Indicator Diagrams in Marine Diesel Engines: Complete MEO Class 4 Guide
- DMET Cadets

- 13 minutes ago
- 12 min read

Indicator diagrams are an important part of marine diesel engine performance analysis. They allow a marine engineer to study the pressure developed inside an engine cylinder during the working cycle and identify abnormalities in combustion, injection timing, compression and exhaust operation.
For MEO Class 4 examinations, it is important to understand not only the definition of an indicator diagram, but also the different types of cards, the procedure for taking them, the precautions involved, interpretation of abnormal diagrams and the calculation of indicated power.
This article provides a complete, exam-oriented guide to indicator diagrams, with special attention to questions commonly asked in MEO Class 4 examinations.
What Is an Indicator Diagram?

An indicator diagram is a graphical representation of the pressure developed inside an engine cylinder during a complete working cycle.
The diagram is obtained using an indicator instrument connected to the indicator cock of the cylinder.
The cylinder pressure acts on the indicator piston, while the movement of the engine piston is transmitted to the indicator mechanism.
The resulting diagram provides valuable information about the condition and performance of the individual cylinder.
An indicator diagram can be used to determine or assess:
Compression pressure
Maximum firing pressure
Combustion condition
Injection timing
Ignition point
After-burning
Exhaust-valve operation
Scavenging condition
Indicated mean effective pressure
Indicated power
Cylinder-to-cylinder performance
In modern marine engines, electronic pressure transducers and crank-angle sensors can provide continuous cylinder-pressure diagrams and calculated engine-performance data.
Why Are Indicator Diagrams Taken?

The main purpose of taking indicator diagrams is to assess the condition of individual cylinders and compare their performance.
A cylinder may appear to be operating normally from the engine-room parameters, but its indicator diagram may reveal:
Excessive maximum firing pressure
Low compression pressure
Delayed combustion
Early combustion
After-burning
Poor fuel injection
Exhaust-valve timing problems
Unequal power production
Therefore, an indicator diagram is an important diagnostic tool for the marine engineer.
The engineer should not analyse the diagram alone. It should be compared with other cylinders and correlated with engine operating parameters such as exhaust temperature, fuel-pump index, engine load, scavenge pressure and turbocharger condition.
Power Card vs Indicator Card vs Draw Card
Card | What it shows | Main purpose | Taken during |
Power Card | Cylinder pressure vs. piston position/volume | Calculate indicated power and assess combustion | Normal engine operation |
Indicator Card | Cylinder pressure vs. crank angle | Study combustion, injection and ignition | Normal firing |
Draw Card | Cylinder pressure during suction & exhaust | Check scavenging and exhaust system | Fuel cut-off / non-firing condition |
Conditions for Proper Indicator Card Analysis
The operating condition of the ship and engine can affect the indicator diagram.
For a meaningful comparison, the following conditions should preferably be considered:
The propeller should be fully immersed.
The ship should be suitably laden and on an even keel.
The ship should not be operating under abnormal wind or heavy sea conditions.
The hull should not be excessively fouled.
If the ship is lightly loaded, the propeller is partly immersed, or the ship is operating with favourable wind or sea conditions, the engine may not develop the same power at a particular speed.
Therefore, the indicator diagram may become misleading if operating conditions are not taken into consideration.
Information to Record Along With an Indicator Diagram
For proper analysis, the following information should be recorded:
Unit or cylinder number
Indicator spring rating
Engine RPM
Fuel-pump index
Governor index
Load index
Exhaust-gas temperature
Exhaust-gas pressure
Jacket-cooling-water outlet temperature
Piston-cooling parameters
Scavenge-air temperature
Scavenge-air pressure
Turbocharger RPM
Exhaust-gas back pressure
Air-cooler differential pressure
Air-filter inlet temperature
Fuel consumption
Cylinder-oil consumption
Ship's draught
These values help the engineer determine whether an abnormal diagram is caused by an individual cylinder fault or by a common engine-system problem.
Types of Indicator Cards
There are several types of indicator cards used for different purposes.
5.1 Power or In-Phase Card

The power card is the main indicator diagram used to study the complete pressure cycle.
It provides information about:
Cylinder power
Mean indicated pressure
Maximum firing pressure
Combustion condition
After-burning
The area enclosed by the power diagram is related to the work produced by the cylinder.
5.2 Draw or Out-of-Phase Card

The draw card is also called the out-of-phase card.
It is mainly used for:
Measuring compression pressure
Determining the approximate point of fuel ignition
Studying injection and combustion timing
The draw card is particularly useful when investigating early or late ignition.
5.3 Light or Weak Spring Card

A light or weak spring card is used mainly to study gas-flow conditions.
It can provide information about:
Exhaust-gas flow
Scavenge-gas flow
Exhaust restrictions
Scavenge restrictions
Fouling of exhaust or scavenge passages
5.4 Compression Card

The compression card is used for:
Measuring compression pressure
Checking indicator timing
Assessing the compression condition of the cylinder
5.5 Pressure-Derivative Card

A pressure-derivative card provides information about:
Point of fuel ignition
Rate of pressure rise following ignition
It can therefore provide additional information about combustion behaviour.
Procedure for Taking an Indicator Card
The correct procedure is important for both safety and accuracy.
Step 1: Wear Proper PPE
Wear suitable:
Gloves
Safety goggles
Safety shoes
Appropriate protective clothing
The indicator cock and instrument may be exposed to high-temperature combustion gases.
Step 2: Prepare the Indicator
Before connecting the instrument:
Clean the indicator piston and cylinder.
Lubricate the moving parts as required.
Check the piston for correct tightness.
Ensure that the correct spring is fitted.
Excessive friction can distort the diagram.
Step 3: Clean the Indicator Cock
Open the indicator cock carefully and allow two or three firing strokes to blow out soot and combustion residues accumulated in the passage.
Step 4: Fit the Diagram Paper
Stretch the diagram paper firmly over the indicator drum.
The paper should be secure and free from excessive movement.
Step 5: Connect the Indicator
Fasten the indicator securely to the indicator cock.
The cord should be correctly positioned and sufficiently taut.
Step 6: Take the Atmospheric Line
With the indicator cock shut, take the atmospheric reference line.
Step 7: Take the Power Diagram
Open the indicator cock and lightly press the stylus against the paper.
Operate the indicator mechanism so that the complete cycle is recorded.
The stylus pressure should be light to avoid distortion.
Step 8: Close the Indicator Cock
After obtaining the required diagram:
Close the indicator cock.
Disconnect the indicator.
Avoid unnecessary exposure of the instrument to high temperature.
Step 9: Take the Compression Line
Where required, take the compression line with the fuel cut off.
After completing the work, clean and lubricate the indicator.
Precautions While Taking Indicator Cards
The following precautions are important:
The indicator piston and cylinder should be clean and properly lubricated.
Indicator piston tightness should be checked.
The drum should not strike its stops.
Play in the pencil mechanism should be minimised.
The indicator cock should be free from soot and oil deposits.
The stylus should be adjusted to apply light writing pressure.
The indicator drum mechanism should be correctly positioned.
The indicator should not be unnecessarily exposed to high temperature.
The correct indicator spring should be used.
The indicator instrument should be cleaned after use.
A wrongly adjusted indicator can produce a distorted diagram and lead to an incorrect diagnosis.
Normal Indicator Diagram
A normal indicator diagram should show a smooth and consistent pressure pattern.
The compression curve should be normal, combustion should occur at the correct timing, the maximum firing pressure should be within the manufacturer's specified range and the expansion curve should be smooth.
The actual pressure values should always be compared with the manufacturer's recommended operating values rather than relying only on a general numerical value.
Early Fuel Injection
What Is Early Fuel Injection?

Early fuel injection occurs when fuel injection starts earlier than the specified injection timing.
If combustion begins earlier than intended, cylinder pressure can rise too early and the maximum firing pressure may become excessive.
Typical indicator-card indications include:
Compression pressure is approximately normal.
Pressure rise begins earlier than normal.
Maximum firing pressure is higher than normal.
The pressure peak occurs earlier than expected.
Important MEO Class 4 concept:
EARLY INJECTION
→ EARLY COMBUSTION
→ EARLY PRESSURE RISE
→ HIGH Pmax
→ INCREASED MECHANICAL LOADING
Causes of Early Fuel Injection
Possible causes include:
10.1 Incorrect Fuel-Pump Timing
Incorrect fuel-pump timing can cause fuel delivery to begin earlier than specified.
10.2 Incorrect Cam Timing
Incorrect adjustment or timing of the fuel cam can alter the beginning of fuel injection.
10.3 Incorrect VIT Setting
On engines fitted with Variable Injection Timing (VIT), an incorrect setting can advance the injection timing.
10.4 Faulty or Incorrectly Adjusted Injector
A faulty or incorrectly adjusted fuel injector can disturb the normal fuel-injection and combustion process.
10.5 Abnormal Fuel Characteristics
Fuel quality and combustion characteristics can influence the ignition and combustion process.
Effects of Early Injection
Early injection can result in:
Excessively high maximum firing pressure
Rapid pressure rise
Increased mechanical loading
Harsh combustion
Knocking tendency
Increased loading on bearings and running gear
Increased stress on engine components
Possible component damage if the condition continues
For an MEO Class 4 oral examination, a concise answer can be:
"Early injection causes combustion to occur earlier than normal, resulting in an early pressure rise and generally higher maximum firing pressure. I would check the fuel-pump timing, cam timing, VIT setting and injector condition."
Late Fuel Injection

Late fuel injection occurs when fuel injection starts later than the specified timing.
This delays combustion and causes the pressure rise to occur later in the cycle.
Typical indications:
Compression pressure may be approximately normal.
Pressure rise occurs late.
Maximum firing pressure is lower than normal.
Combustion continues further into the expansion stroke.
Exhaust temperature may increase.
Engine power may decrease.
Causes of Late Injection
Possible causes include:
Poor fuel quality
Blocked fuel-injector nozzle
Leaking fuel pump
Low fuel pressure
Seized or faulty injector
Incorrect fuel timing
Poor fuel atomisation
Easy MEO Class 4 memory:
LATE INJECTION
→ LATE COMBUSTION
→ LOW Pmax
→ MORE COMBUSTION DURING EXPANSION
→ POSSIBLE HIGH EXHAUST TEMPERATURE
Early Injection vs Late Injection
Early and late injection are commonly compared during MEO examinations.
EARLY INJECTION
Injection starts too early.
Pressure rise starts early.
Pmax is generally high.
Mechanical loading increases.
Check pump timing, cam timing, VIT and injector.
LATE INJECTION
Injection starts too late.
Pressure rise starts late.
Pmax is generally low.
Combustion extends further into expansion.
Check injector, pump, fuel pressure, fuel quality and timing.

Low Compression Pressure and Low Pmax

When both compression pressure and maximum firing pressure are low, the engineer should investigate the compression condition of the cylinder.
Possible causes include:
Leaking exhaust valve
Worn piston rings
Broken piston rings
High liner wear
Leakage past piston rings
Burnt piston crown
Low scavenge-air pressure
The general diagnostic relationship is:
LOW COMPRESSION
→ POOR COMPRESSION CONDITION
→ LOW COMBUSTION PRESSURE
→ REDUCED CYLINDER POWER
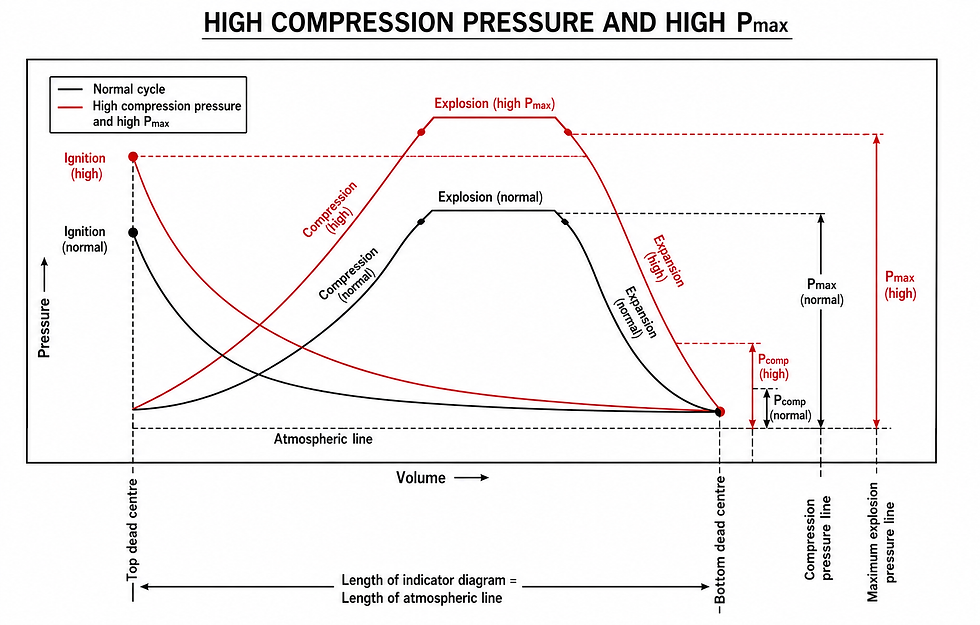
High Compression Pressure and High Pmax

High compression pressure together with high maximum firing pressure may result from:
Exhaust valve opening too late
Incorrect exhaust-valve timing
Engine overload
The actual values should always be compared with the manufacturer's normal operating limits.
What Is After-Burning?

After-burning occurs when combustion continues during the later portion of the expansion stroke.
Normally, the majority of combustion should occur around the intended combustion period. If fuel continues burning significantly into expansion, the indicator diagram may show an abnormal rise or bulge in the expansion line.
Indications of After-Burning
Abnormal rise in the expansion line
Increased exhaust-gas temperature
Increased exhaust-gas pressure
Incomplete combustion
Black smoke
Carbon deposits
Exhaust-system fouling
Possible Effects
Continued after-burning can result in:
Exhaust-valve fouling
Turbocharger fouling
Increased thermal loading
Increased liner and piston-ring wear
Carbon deposits
Possible exhaust-gas economiser/uptake problems
Leaking Fuel Injector

A leaking fuel injector can produce abnormal combustion and an irregular indicator diagram.
Possible indications include:
Reduced cylinder power
High exhaust temperature
Black smoke
Abnormal pressure fluctuations
Poor atomisation
After-burning
A blocked injector nozzle can similarly produce poor atomisation and abnormal combustion.
Partly Choked Fuel Valve

A partly choked fuel valve can reduce fuel delivery and cylinder power.
Possible causes include:
Fuel contamination
Improper fuel purification
Carbon deposits
Deposits around the injector tip
Overheating of the fuel valve
The affected cylinder may show abnormal power-card characteristics.
Low Compression

Low compression pressure may result from:
Worn piston rings
Broken piston rings
Excessive liner wear
Leaking exhaust valve
Burnt piston crown
Insufficient air supply
Low compression can reduce the temperature reached at the end of compression and adversely affect combustion.
Exhaust-Valve Timing Abnormalities
A light-spring diagram can help investigate exhaust-valve operation.
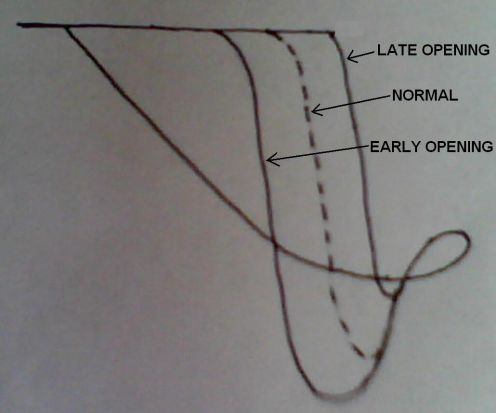
Early Exhaust-Valve Opening
Possible effects include:
Increased exhaust losses
Reduced effective expansion
Loss of engine power
Abnormal exhaust conditions
Late Exhaust-Valve Opening
Possible effects include:
Reduced blow-down period
Poor scavenging
Increased exhaust-gas pressure
Reduced efficiency of exhaust-gas flow to the turbocharger
Correct exhaust-valve timing is therefore important for both cylinder performance and scavenging.
Choked Exhaust

A choked or restricted exhaust system can cause:
Increased exhaust-gas temperature
Increased exhaust back pressure
Loss of cylinder power
Reduced scavenging efficiency
Turbocharger problems or surging
Possible causes include combustion deposits and excessive fouling.
How to Analyse an Abnormal Indicator Diagram
A systematic approach makes diagnosis easier.
Step 1: Check Compression Pressure
Is compression pressure normal?
If it is low, investigate:
Piston rings
Liner
Exhaust valve
Piston crown
Scavenge-air pressure
Step 2: Check Pmax
Is maximum firing pressure normal?
If Pmax is high, investigate:
Early combustion
Injection timing
VIT
Engine overload
If Pmax is low, investigate:
Late injection
Fuel-system problems
Poor combustion
Low compression
Step 3: Check the Pressure-Rise Position
If the pressure rise occurs too early:
Suspect early injection/early combustion.
If the pressure rise occurs too late:
Suspect late injection/late combustion.
Step 4: Check the Expansion Line
A rise or abnormal bulge during late expansion can indicate after-burning.
Step 5: Compare Other Parameters
Check:
Exhaust temperature
Fuel-pump index
Engine load
Scavenge pressure
Scavenge temperature
Turbocharger condition
Fuel condition
Step 6: Compare With Other Cylinders
If only one cylinder is abnormal, investigate cylinder-specific components.
If all cylinders show a similar abnormality, investigate common systems such as:
Fuel system
Scavenge-air system
Turbocharger
Air cooler
Exhaust system
Calculation of Indicated Power
One of the most important numerical applications of an indicator diagram is calculating the indicated power of a cylinder.
The area of the indicator diagram represents the work performed during the cycle.
First, the mean height of the diagram is determined.
Let:
a = Area of indicator diagram in mm²
l = Length of indicator diagram in mm
Then:
Mean height = a/l
Therefore:
Pₘ = (a/l) × k
where:
Pₘ = Mean indicated pressure
k = Indicator spring scale in bar/mm
Therefore:
Pₘ = (a/l) × k bar
Piston Area
If the cylinder bore is D:
A = πD²/4
Where:
A = Piston area in m²
D = Cylinder bore in metres
Work Done Per Cycle
The work done in one cycle is:
W = Pₘ × A × L
Where:
Pₘ = Mean indicated pressure
A = Piston area
L = Stroke
If pressure is expressed in bar:
1 bar = 10⁵ N/m²
Therefore:
W = Pₘ × 10⁵ × A × L
Indicated Power Formula
The general formula for indicated power is:
IP = Pₘ × A × L × N
Where:
IP = Indicated power
Pₘ = Mean indicated pressure
A = Piston area
L = Stroke
N = Number of power strokes per second
When Pₘ is in bar:
IP = Pₘ × 10⁵ × A × L × N
The result is obtained in watts.
Power Strokes in a Two-Stroke Engine
In a two-stroke engine, there is approximately one power stroke for every revolution.
Therefore:
N = RPM/60
Hence:
IP = Pₘ × 10⁵ × A × L × RPM/60
Power Strokes in a Four-Stroke Engine
In a four-stroke engine, there is one power stroke for every two revolutions.
Therefore:
N = RPM/120
Hence:
IP = Pₘ × 10⁵ × A × L × RPM/120
MEO Class 4 Numerical Example
Question: An indicator diagram has an area of 800 mm² and a length of 100 mm. The indicator spring scale is 1 bar/mm.
The engine cylinder has:
Bore = 0.40 m
Stroke = 0.50 m
Speed = 120 RPM
Engine = Two-stroke
Calculate the indicated power.
Solution:
Step 1: Calculate mean height.
Mean height = Area/Length
= 800/100
= 8 mm
Step 2: Calculate mean indicated pressure.
Pₘ = Mean height × Spring scale
= 8 × 1
= 8 bar
Step 3: Convert pressure to SI units.
Pₘ = 8 × 10⁵ N/m²
Step 4: Calculate piston area.
A = πD²/4
A = π × (0.40)²/4
A = 0.1257 m²
Step 5: Calculate power strokes per second.
For a two-stroke engine:
N = RPM/60
N = 120/60
N = 2 power strokes/second
Step 6: Calculate indicated power.
IP = Pₘ × A × L × N
IP = 8 × 10⁵ × 0.1257 × 0.50 × 2
IP ≈ 100,500 W
Therefore:
INDICATED POWER ≈ 100.5 kW
Important MEO Class 4 Exam Questions
Question 1: What is an indicator diagram?
Answer: An indicator diagram is a graphical representation of cylinder pressure during an engine cycle. It is used to assess combustion, compression, injection timing, maximum firing pressure and cylinder power.
Question 2: What is the purpose of a power card?
Answer: A power card is used to assess cylinder combustion, maximum firing pressure and cylinder power. Its area can be used to determine mean indicated pressure and indicated power.
Question 3: What is a draw card?
Answer: A draw card is an out-of-phase indicator diagram used mainly to determine compression pressure and the approximate point of ignition.
Question 4: How do you identify early injection?
Answer: Early injection is indicated by an earlier pressure rise and generally high maximum firing pressure, while compression pressure may remain approximately normal.
Question 5: What are the causes of early injection?
Answer: Incorrect fuel-pump timing, incorrect cam timing, incorrect VIT setting and faulty or incorrectly adjusted fuel injectors are possible causes.
Question 6: What are the effects of early injection?
Answer: High Pmax, rapid pressure rise, harsh combustion, increased mechanical loading and possible damage to engine components.
Question 7: How do you identify late injection?
Answer: Late injection generally results in a late pressure rise and low Pmax, with combustion continuing further into the expansion stroke.
Question 8: What causes low compression pressure?
Answer: Possible causes include worn or broken piston rings, excessive liner wear, leaking exhaust valve, burnt piston crown and inadequate scavenge-air pressure.
Question 9: What is after-burning?
Answer: After-burning is continued combustion during the later portion of the expansion stroke. It is indicated by an abnormal rise or bulge in the expansion line.
Question 10: Give the formula for indicated power.
Answer:
IP = Pₘ × A × L × N
When Pₘ is in bar:
IP = Pₘ × 10⁵ × A × L × N